


Q3 2024 NW FL Vacation Rental Market Report
In this report, we look at Q3 performance in the Northwest Florida Panhandle vacation rental market regarding occupancy, ADR performance and total revenue estimations per market.

As we have entered “churn season”, I’m receiving calls from prospective owner clients unlike any I have had in my 14 year tenure. Generally, the predominant issue with our competition is operational quality, i.e. housekeeping and maintenance; although revenue concerns are often at issue. However, this year, I have had several calls with prospective owners about revenue performance with their current management company that are much more dramatic than what I’m accustomed to. One case in particular, generated half this year in revenue than what we did in a similar home, directly next door. That’s right, half. 5%, 10% or even 25% less is not uncommon when we talk to potential owner clients, but to hear of one company doing half - to me, this was just gross mis-management. This has been a growing trend I’m hearing and it’s indicative of “professional” managers being completely out of touch with market demand, revenue and occupancy trends and how to manage revenue overall in what I would deem a normal competitive market.
The explosive demand we experienced in 2021 and 2022 was unprecedented and in hindsight, clearly couldn’t last forever. However, when looking at the data, changes in ADR from 2021 and 2022 were less impactful than changes in overall occupancy. When considering the Florida Panhandle market, 2024 annual ADR was $309 and occupancy was 48.7%. These same figures for 2022 were $326 and 54.8%, which constitutes a 5.2% drop in ADR and a 11.1% drop in occupancy. Comparing to 2021, ADR this year is actually up 1.6% over 2021’s figure, however the annual occupancy average was down 18%. When looking at the monthly graph, you can see a meaningful gap in occupancy in the shoulder season periods of April, May, August, September and October when comparing 2021 and 2022 with this year. The big story for this year is not a change in overall ADR’s per se, but rather more of a return to normal occupancy patterns we were accustomed to pre-2020.
Let’s talk about 2019 for a moment. The annual overall occupancy percentage for 2019 was 49%, almost exactly what we saw this year - less than a point off. The monthly occupancy pattern looks almost identical as well. The ADR difference, however, is astounding - 2024’s ADR of $309 was a robust 37% up over 2019’s $225.
Moving forward, to remain competitive, managers and owners need to manage pricing strategies in a way to net market average occupancy or better or they’re missing out. The example I gave above where the owner saw half in revenue of what we generated for a comparable home was not the result of them achieving average occupancy. Their pricing was set way too high and the net result was occupancy far less than market average and the owner (and the manager) lost a lot of money.
Ok, moving on.
Low August Occupancy
I still get a lot of questions from owners that are puzzled about low occupancy in August and September.

The occupancy chart is a good hindsight representation of market demand and offers a visualization of how that demand slips off as we enter August and the fall season. Interestingly, the occupancy percentages of the third and fourth week in August are only slightly higher than what we see in most weeks in November through February (less snowbird visitation). When you compare occupancy percentages from this year to that of 2021, averages are 19% down from that year in this quarter. I attribute that to a return to traditional school and work attendance schedules that was considered conventional pre-2020. Again, when you compare this year’s occupancy pattern to that of 2019, the pattern looks almost identical. Q3 2019 occupancy was approximately 55.6%, almost dead even with this year’s occupancy of 56.7%. Pre-2020, August was always soft compared to July, yet I still talk to owners that have July-revenue expectations for August. August is hot and a wonderful time to be at the beach, but historically the demand cools off after that first week, and so do rates and occupancy.
Q3 2024 Summary
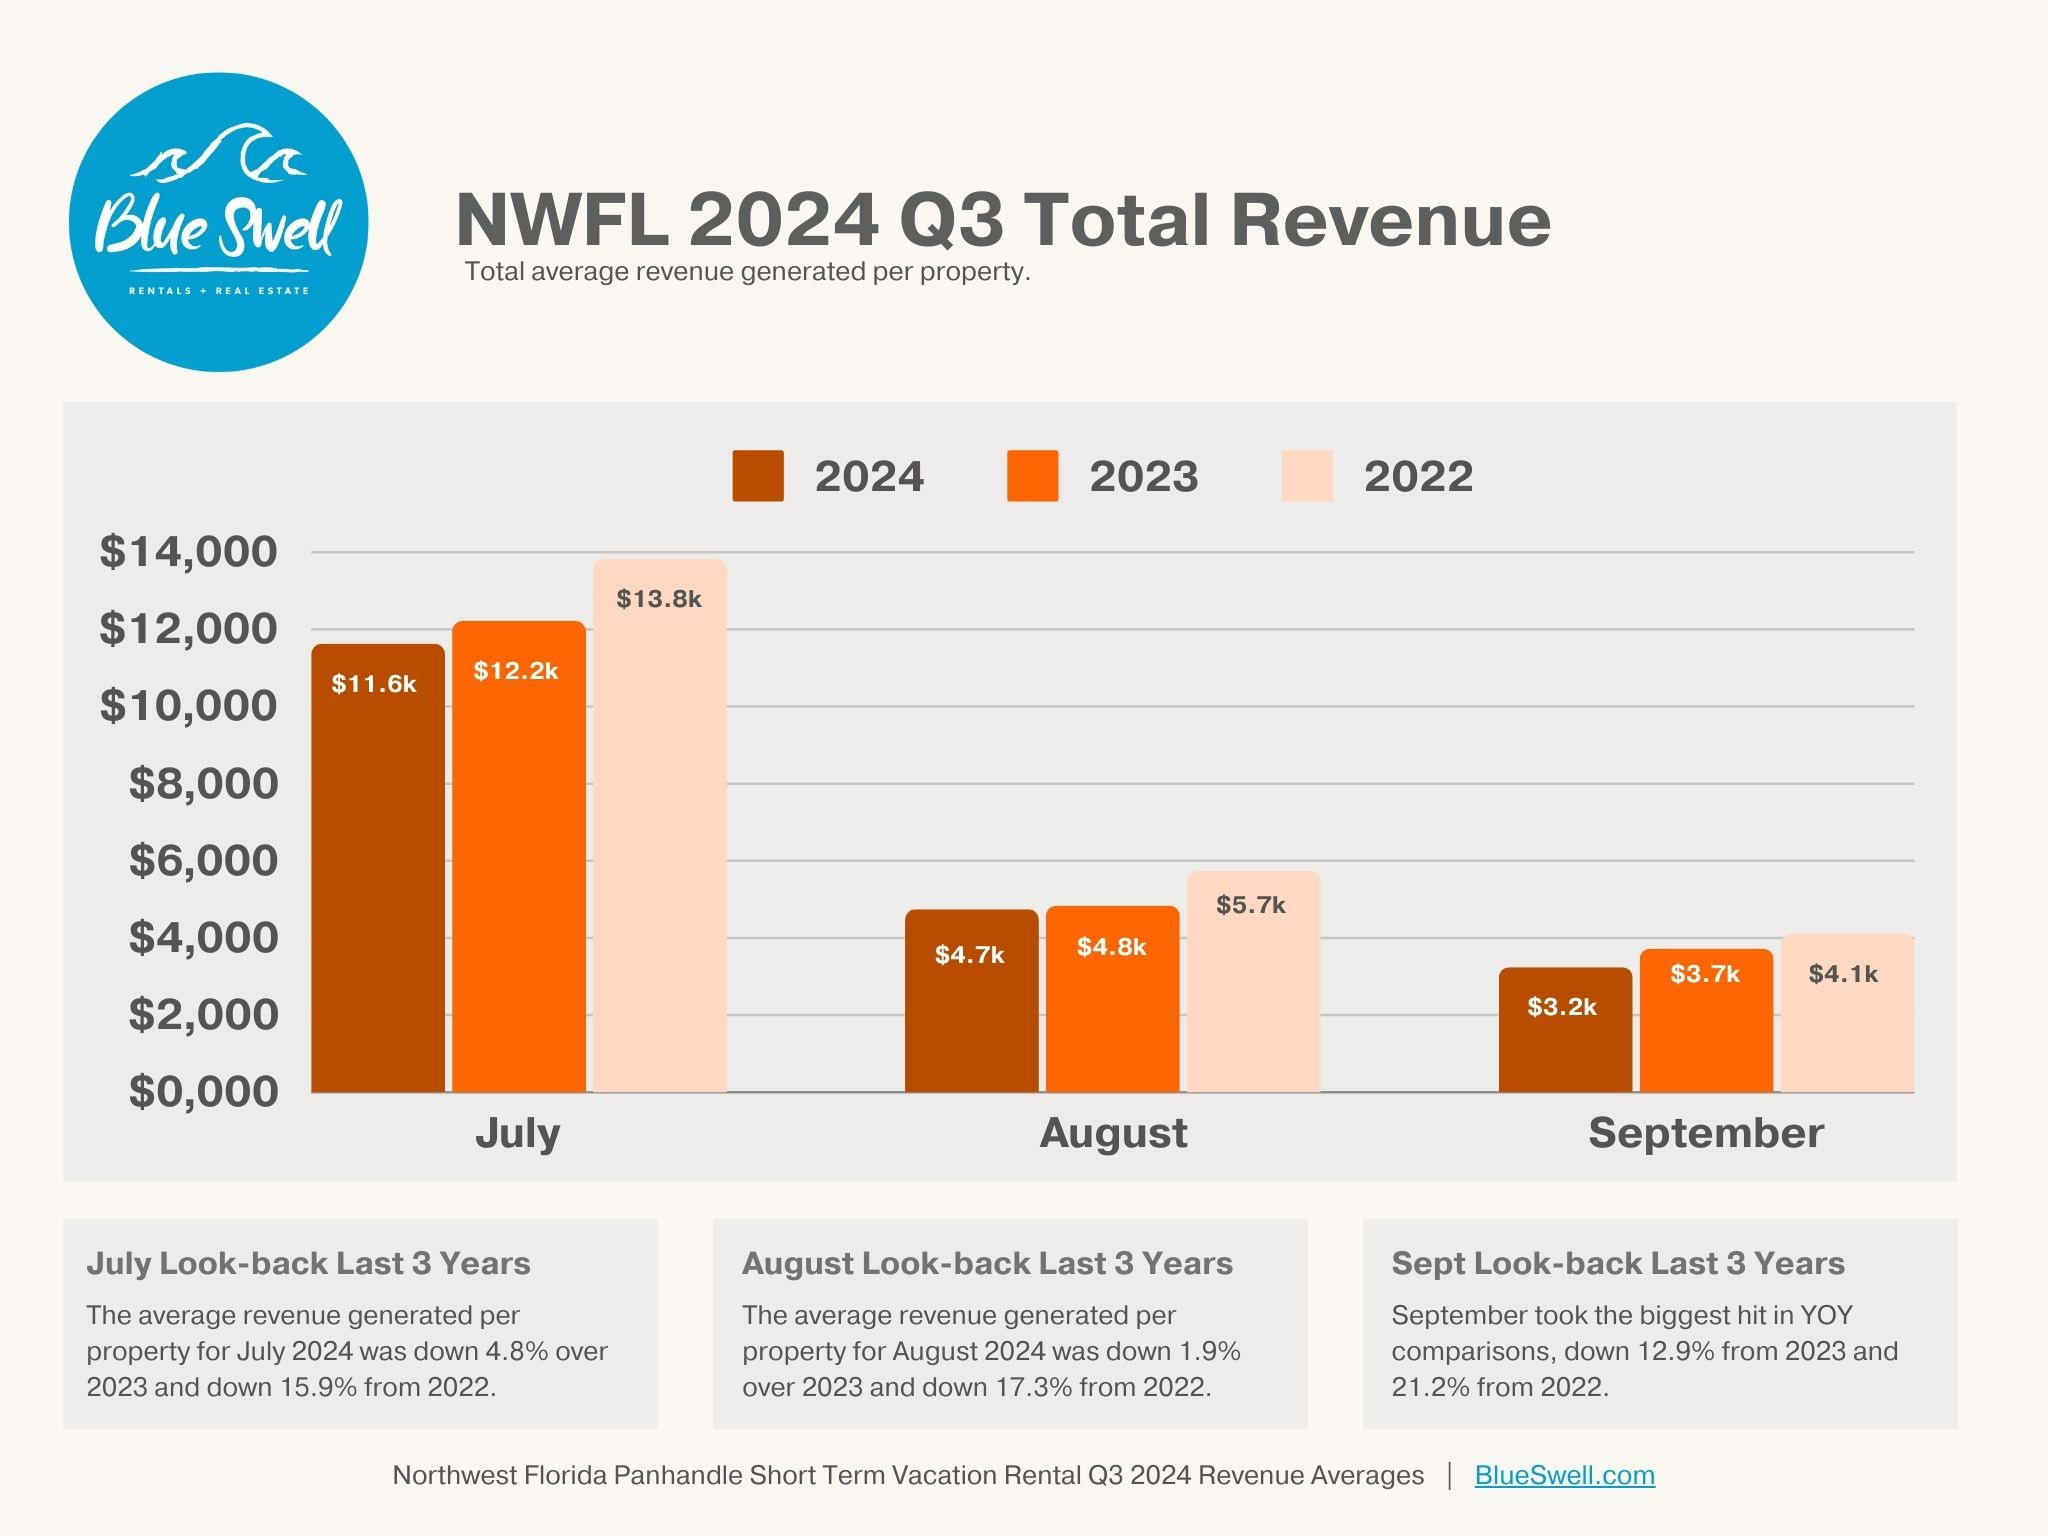
In Q3, we saw what I would consider a continuation of stabilization. ADR’s for the Florida Panhandle market were literally flat year-over-year at $344 with occupancy down about 5%, which was 57%, down from 2023’s 61% for the quarter. Each market saw a variation of this performance but the smaller comparative change is encouraging.
Explanation: Average Revenue Generated Per Property
For a few reports I discussed a KPI called RevPar, or what I prefer to call RevPan. RevPar is “revenue per available room”, a term that comes from the hotel industry. However, in the short term rental industry, we’re not selling rooms, rather we’re selling nights in properties of a variety of sizes, I therefore prefer to use RevPan, short for “revenue per available night”. And while RevPan is an adequate figure to portray changes in year over year revenue representations, the majority of my audience are not analysts and a more natural way to convey the data is to just do the math for you to convert RevPan to total average revenue generated per property for any given period.
RevPan is calculated by taking the total paid occupancy and multiplying it by the ADR of a given period.
Occupancy x ADR = RevPan
Once you have calculated RevPan, you can take it a step further and determine the average revenue generated per property for the period by multiplying the RevPan with the number of days in the period. So, for example, if the RevPan for July was $500, then average revenue for the month would be calculated like so:
$500 x 31 (days in the month) = $15,500.
For further explanation, reference RevPan here.
Table of Contents
Q3 2024 Florida Panhandle Market Performance
Panama City Beach Market
Average Monthly Revenue per Property
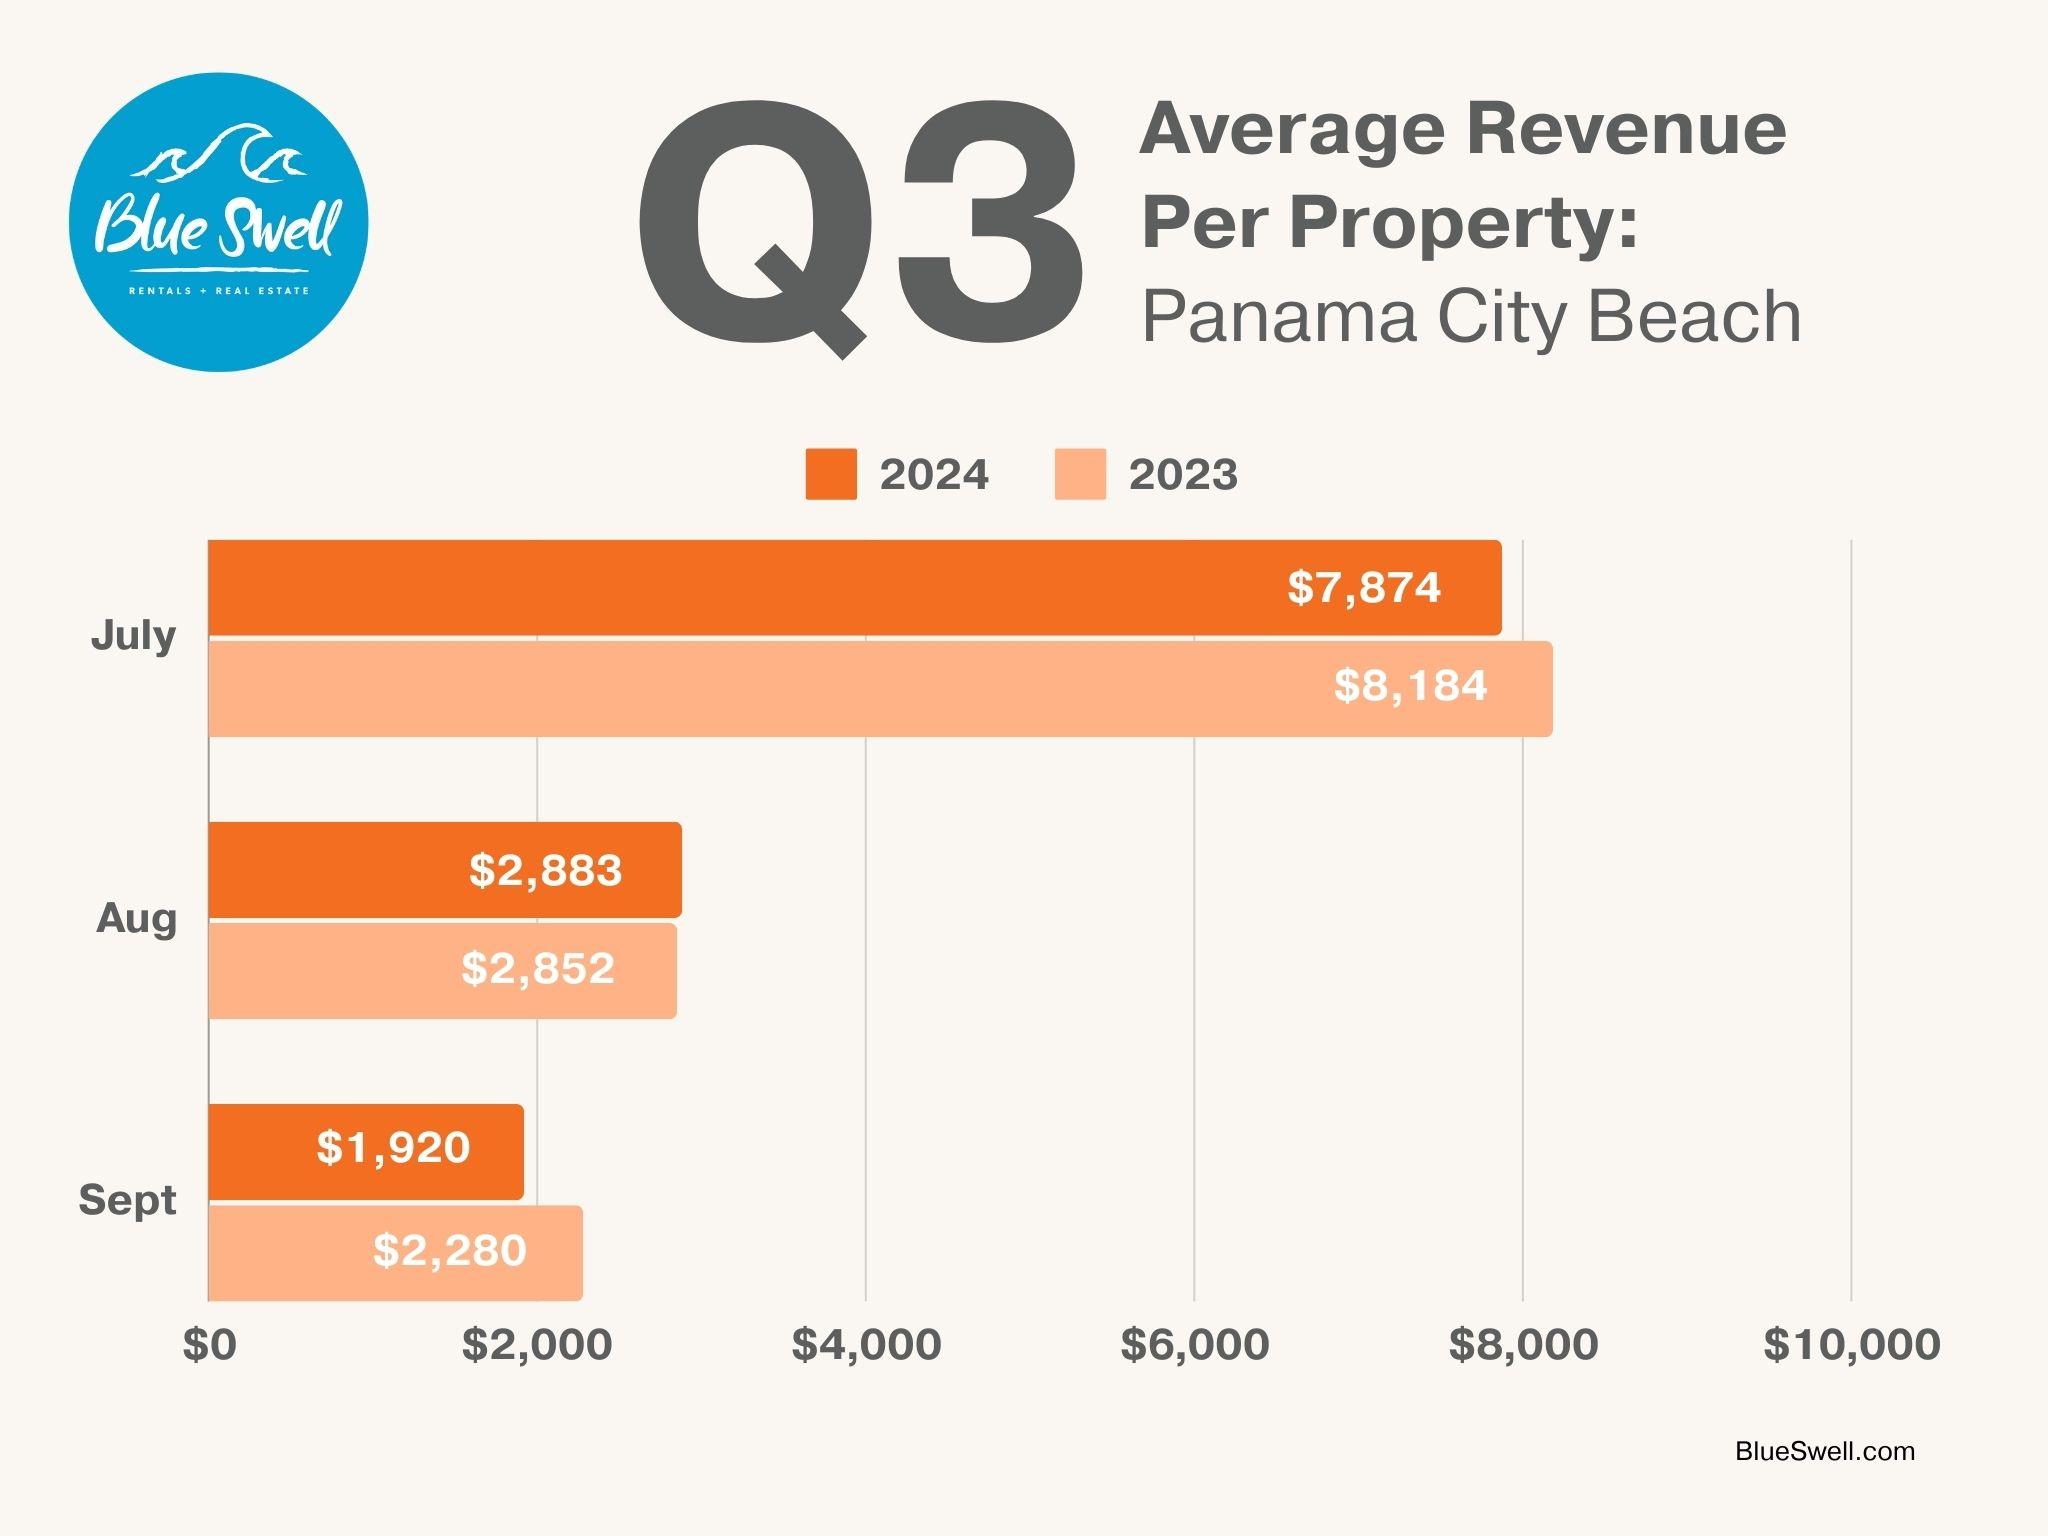
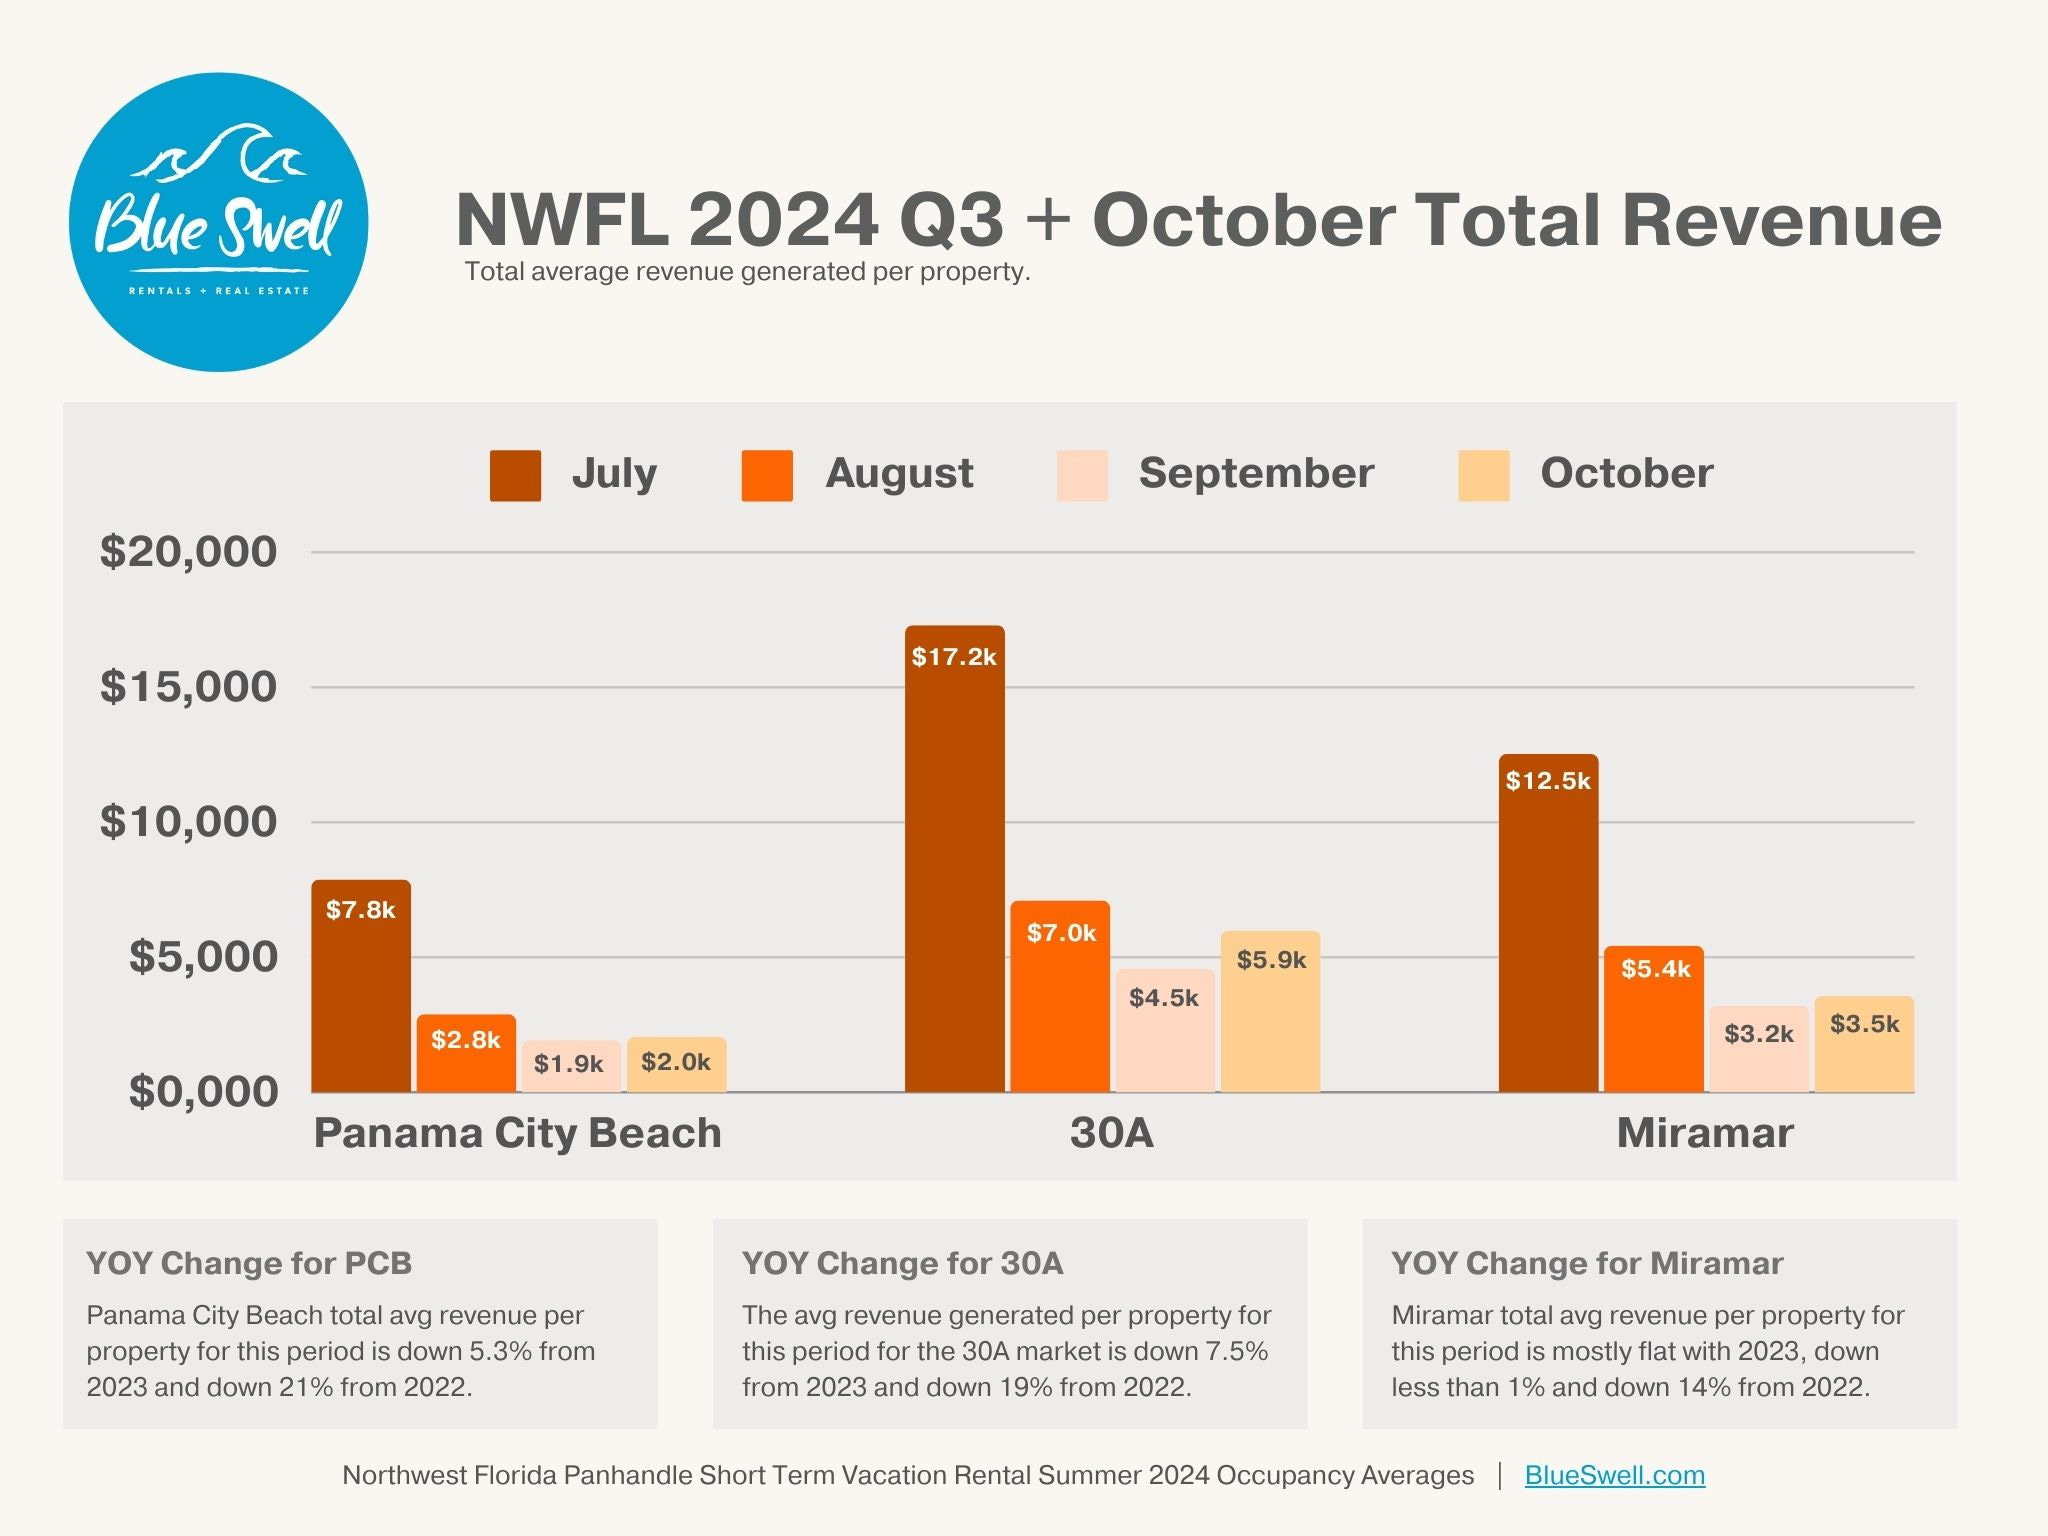
Average total revenue generated per property for the quarter for the Panama City Beach market was approximately $12,677, down 4.8% from 2023’s $13,316. The 4.8% drop is a meaningful percentage but tangibly, it’s a loss of just over $600 from last year, for the entire quarter. September saw the greatest percentage change with August squeezing out a minor gain. The primary driver for the total revenue change in this quarter is a change in occupancy, as you’ll see below. ADR’s were flat YOY. Q3 2024 is down 21.4% from the highs of 2022 but up 18.8% from Q3’s total in 2019 of $10,672.
Adjusted Paid Occupancy Averages

The weeks of July saw a consistent pattern in occupancy over the month (although slightly below) with the monthly average settling 4.8% below last year. The first week in August saw a bump over last year, then dropping off more significantly weeks 2 and 3. The rest of the quarter followed a similar pattern as 2023 with a modest bump for Labor Day and a significant drop end of the month of September.
July 2024 occupancy was 79%, down from 83% in 2023 and down from 85% in 2022.
August 2024 occupancy was 47%, flat with 47% in 2023 and down from 51% in 2022.
September 2024 occupancy was 38%, down from 44% in 2023 and down from 50% in 2022.
Average Daily Rate (ADR)

ADR’s for the quarter are mostly flat year over year. July saw a slight increase of 1%, August about the same with September down 2.3%. All of this is super encouraging as it continues to support the narrative of stabilization. Q3 ADR of $229 for 2024 was down 11.7% from 2022’s average of $259 but up 25.3% from the 2019 Q3 ADR of $183.
July 2024 ADR was $321, up from $318 in 2023 and down from $371 in 2022.
August 2024 ADR was $198, up from $196 in 2023 and down from $230 in 2022.
September 2024 ADR was $169, down from $173 in 2023 and down from $178 in 2022.
30A Market
Average Monthly Revenue per Property
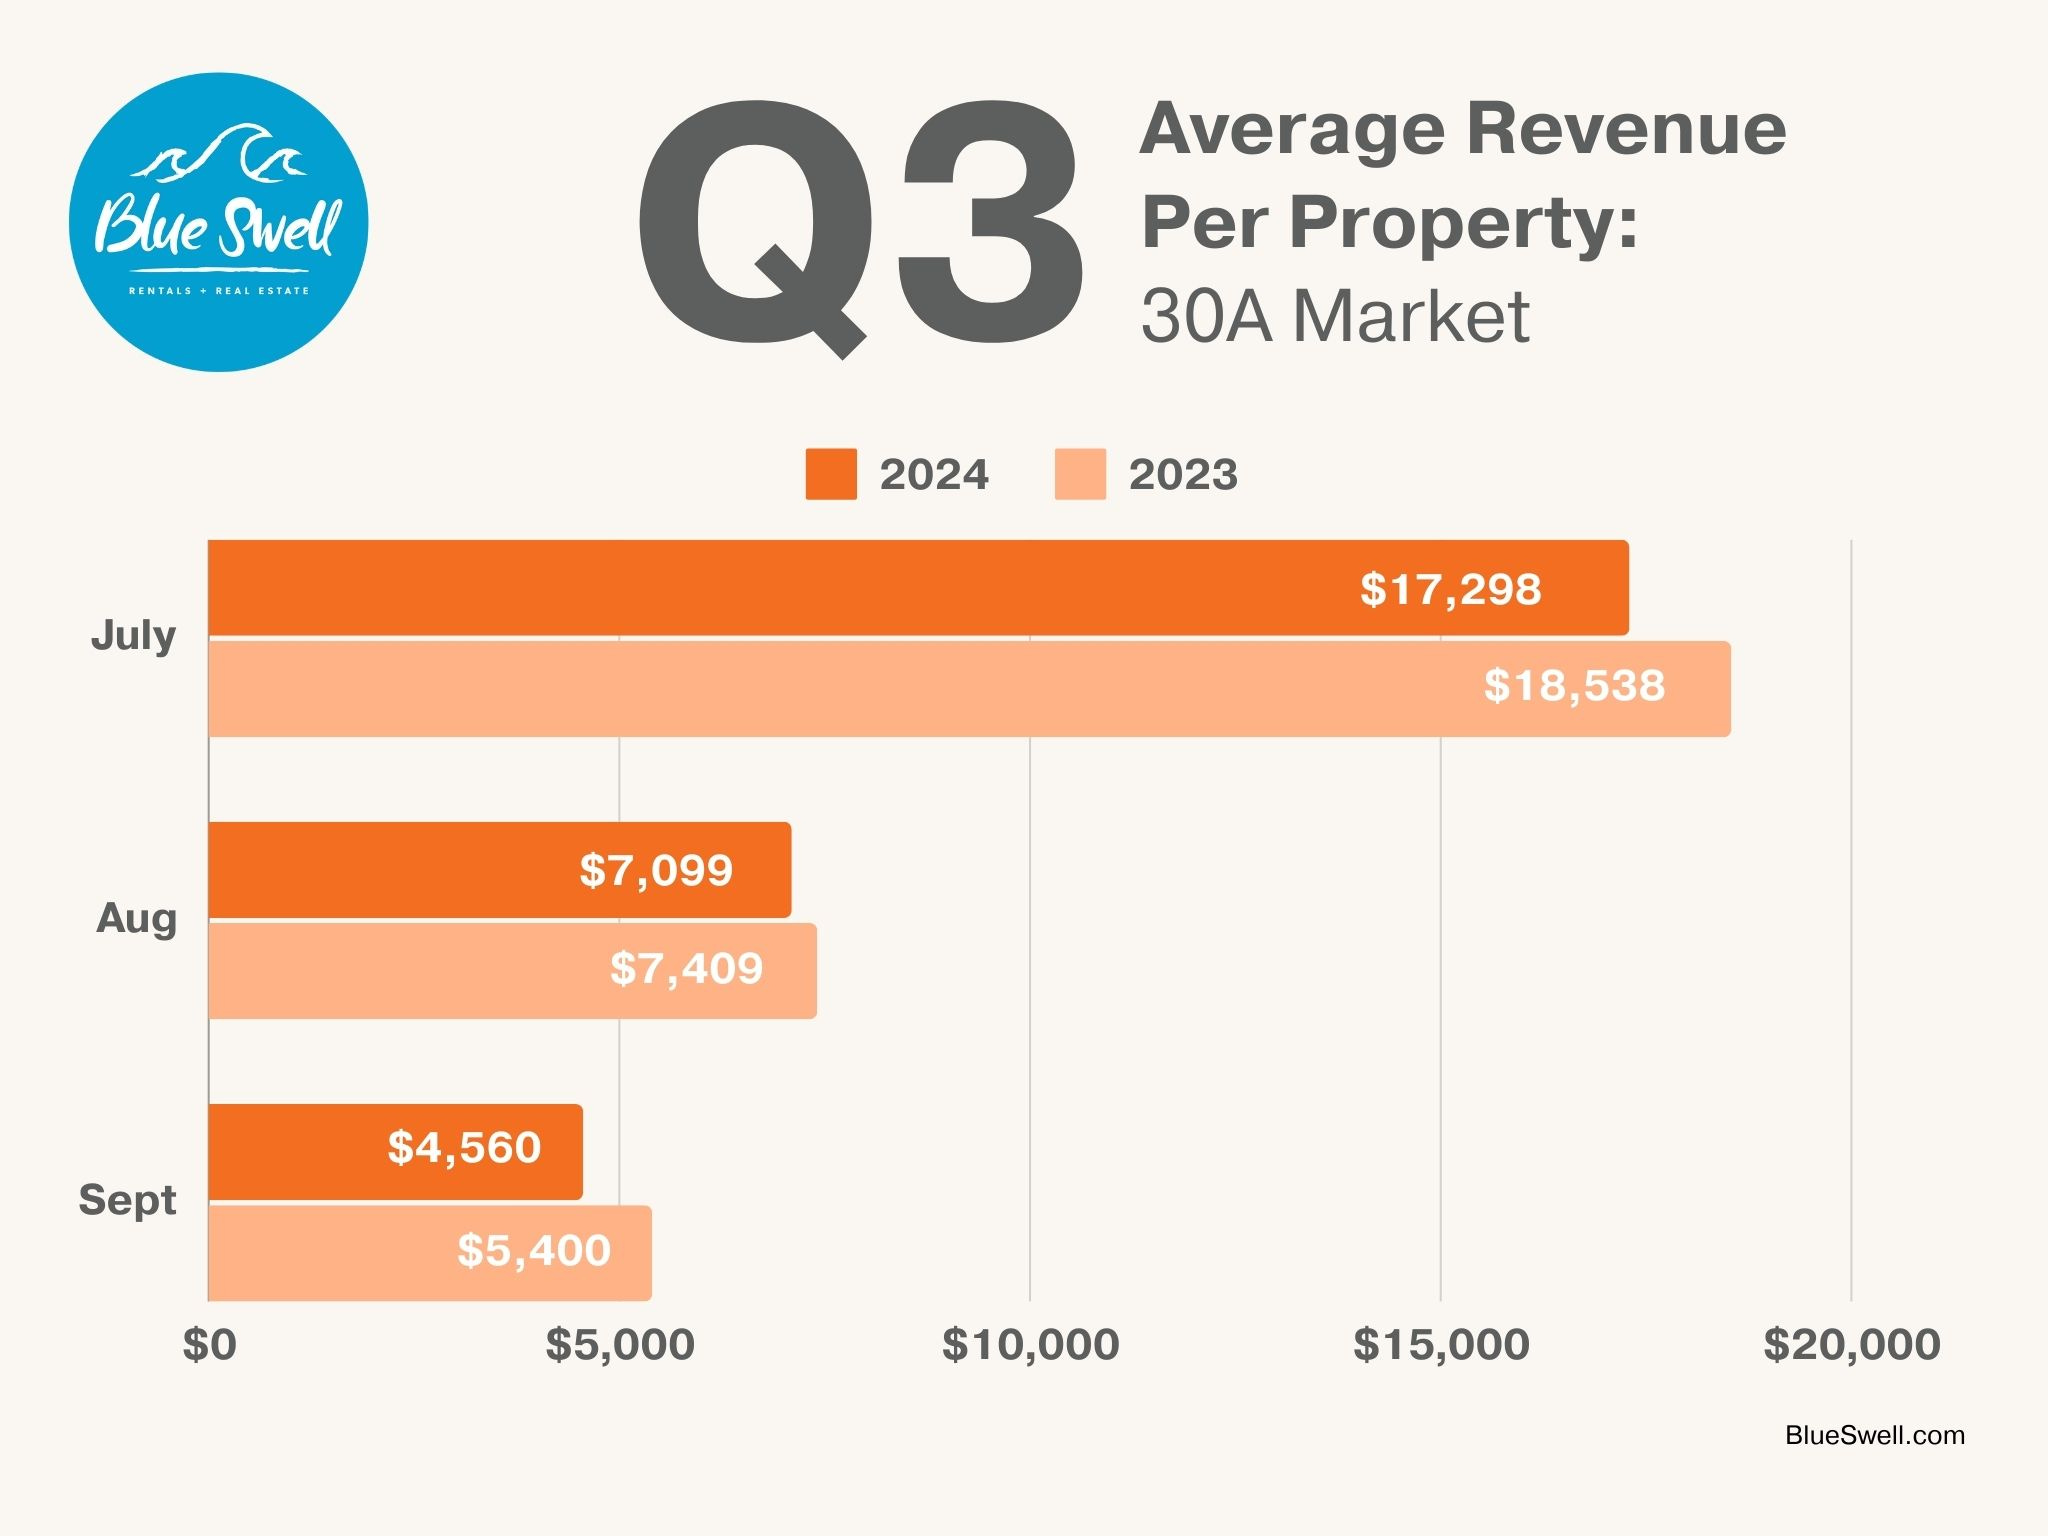
The 30A market for Q3 saw a slightly larger drop in average revenue generated per property than Panama City Beach at 7.6% down YOY. The largest revenue drop was in July, down 6.7% but September, again took the largest percentage drop of 15.6%. Total average revenue per property change YOY was a drop of $2,390 for the quarter. Q3 2024 is down 20.4% from the highs of 2022 but an astounding 52% up over 2019’s average for the quarter of $22,965.
Adjusted Paid Occupancy Averages

As you can see from the chart, occupancy patterns were similar, albeit lower than 2023 in most weeks in the quarter. There was a bump that first week in August but then occupancy fell off more sharply the remaining weeks than the Panama City Beach market. Occupancy for the quarter was 54%, down from 57% in 2023.
July 2024 occupancy was 78%, down from 83% in 2023 and down from 87% in 2022.
August 2024 occupancy was 46%, flat with 46% in 2023 and down from 50% in 2022.
September 2024 occupancy was 37%, down from 41% in 2023 and down from 44% in 2022.
Average Daily Rate (ADR)

Q3 ADR for the 30A market was $542, down 3.6% from 2023’s $562. The first few weeks in July were flat YOY but the week of the 20th and 27th saw enough decline to bring the July average down to $712 from $722 in 2023, a mere 1.4% change. There were minor changes through August and September, but again, the pattern seems to support some stabilization in price. The Q3 2024 ADR of $542 is down 11.3% from the high of $611 in 2022 but up 33.7% from 2019’s $405.
July 2024 ADR was $712, down from $722 in 2023 and down from $802 in 2022.
August 2024 ADR was $503, down from $525 in 2023 and down from $577 in 2022.
September 2024 ADR was $410, down with $439 in 2023 and down from $454 in 2022.
Miramar Beach Market

Average Monthly Revenue per Property
Total estimated average revenue for Q3 for the Miramar Beach market was encouragingly flat year over year. July revenue for Miramar Beach was flat with 2023. Occupancy dipped slightly and ADR’s were up 2.5%, leveling out the year over year revenue. This is an encouraging stabilization as July 2023 was down a whopping 13% from 2022. August revenue was actually up by 5.4%, but September was down 12% stabilizing the year over year change for quarter 3 in Miramar Beach to under 1%, $21,159 in 2024, down from $21,330 in 2023 and down from $24,818 in 2022. Revenue for the quarter has seen a 14.7% drop since 2022 with the change from 2022 to 2023 being the most significant, but a whopping 76.4% above 2019’s $14,017 total average revenue generated per property for the quarter for the Miramar Beach market.
Adjusted Paid Occupancy Averages
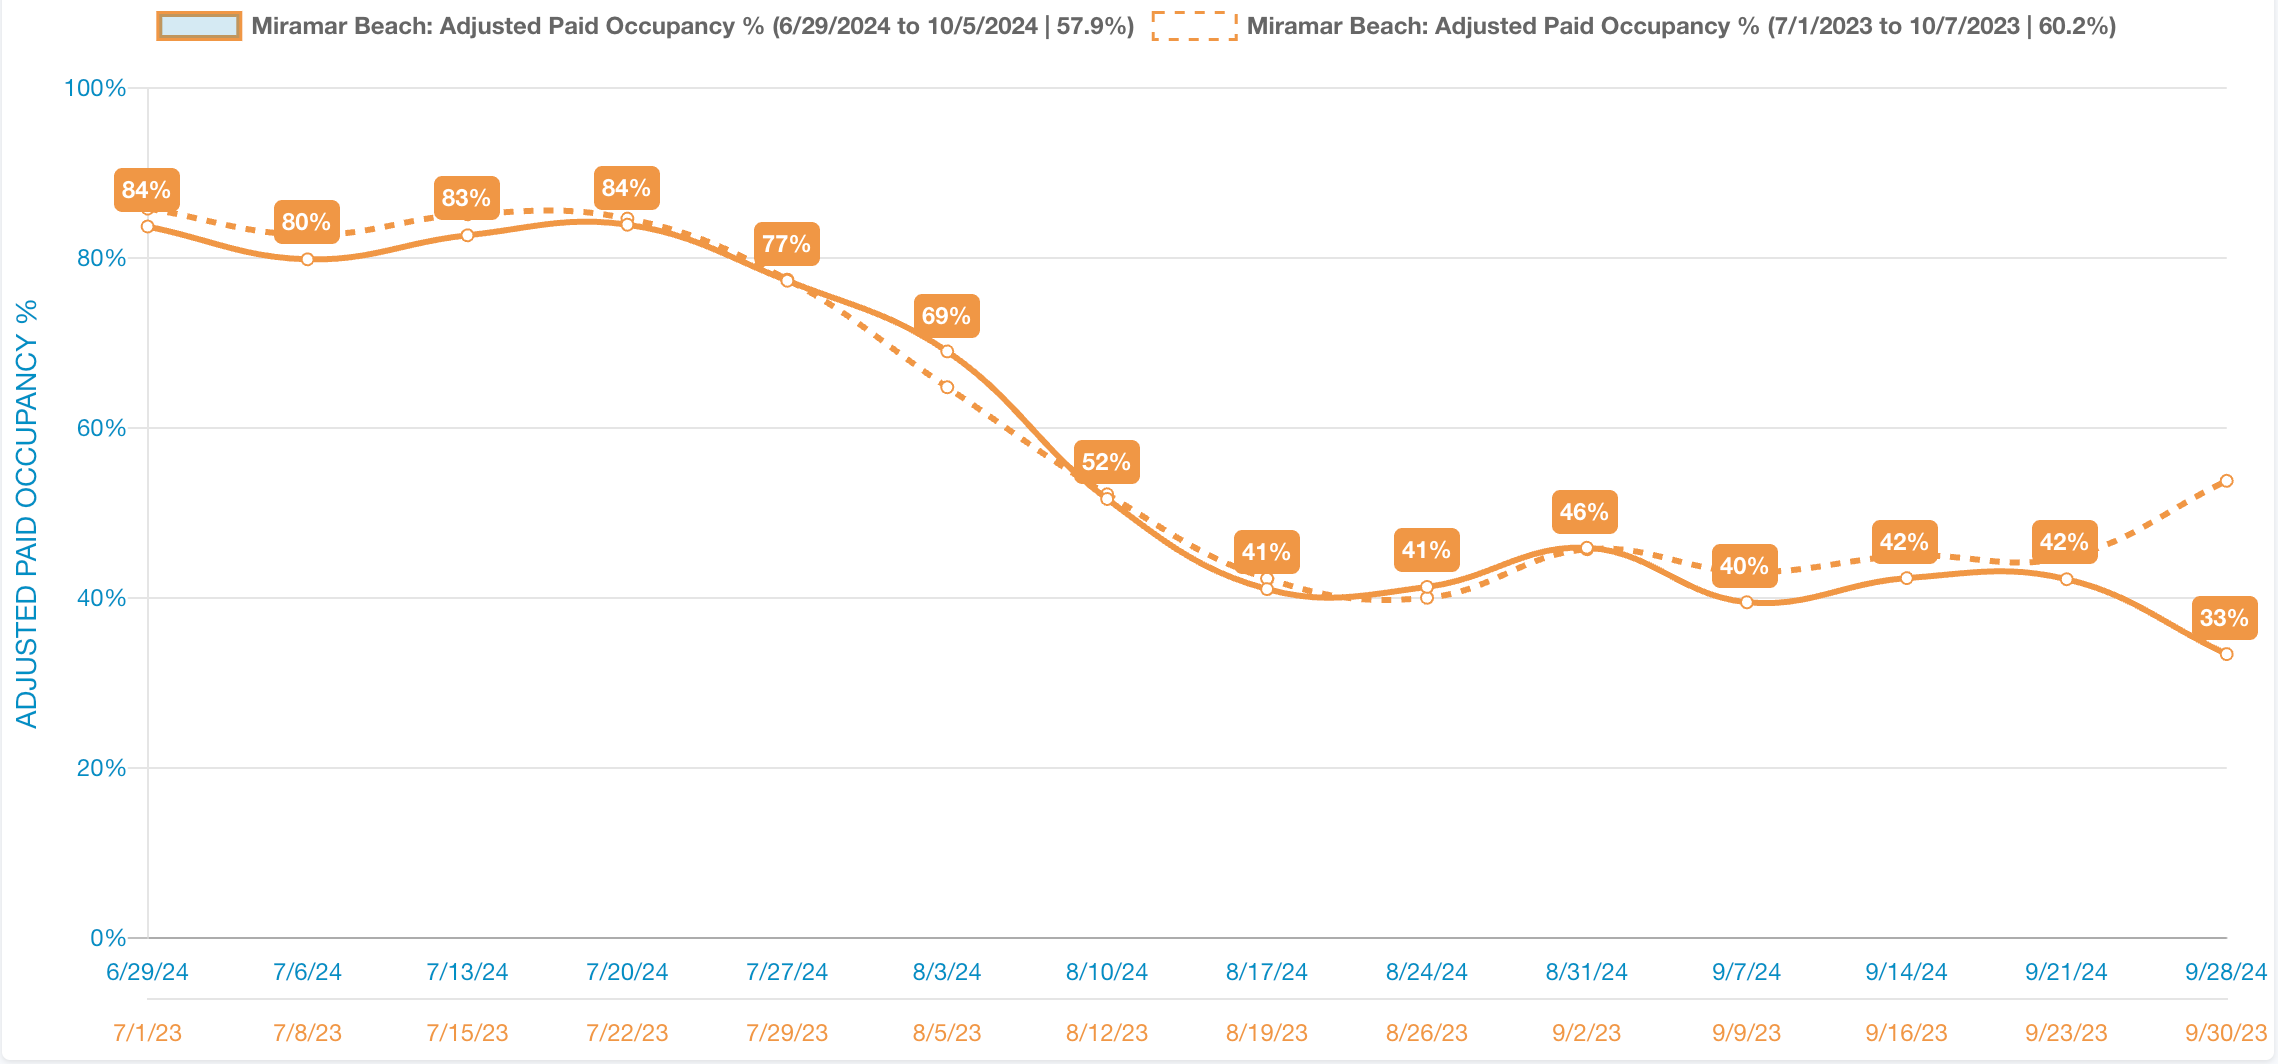
The largest drop in year over year occupancy for the Miramar Beach market was in September, down 13%. With a $1 increase in ADR from 2023, this led to the largest year over year revenue decline for the period. However, looking at the chart above, you can see occupancy patterns for the rest of the period stayed very close to last year, and the first week in August actually had a decent clip ahead over that same week last year.
July 2024 occupancy was 82%, down from 84% in 2023 and down from 87% in 2022.
August 2024 occupancy was 54%, up from 53% in 2023 and down from 55% in 2022.
September 2024 occupancy was 40%, down from 46% in 2023 and down from 49% in 2022.
Average Daily Rate (ADR)
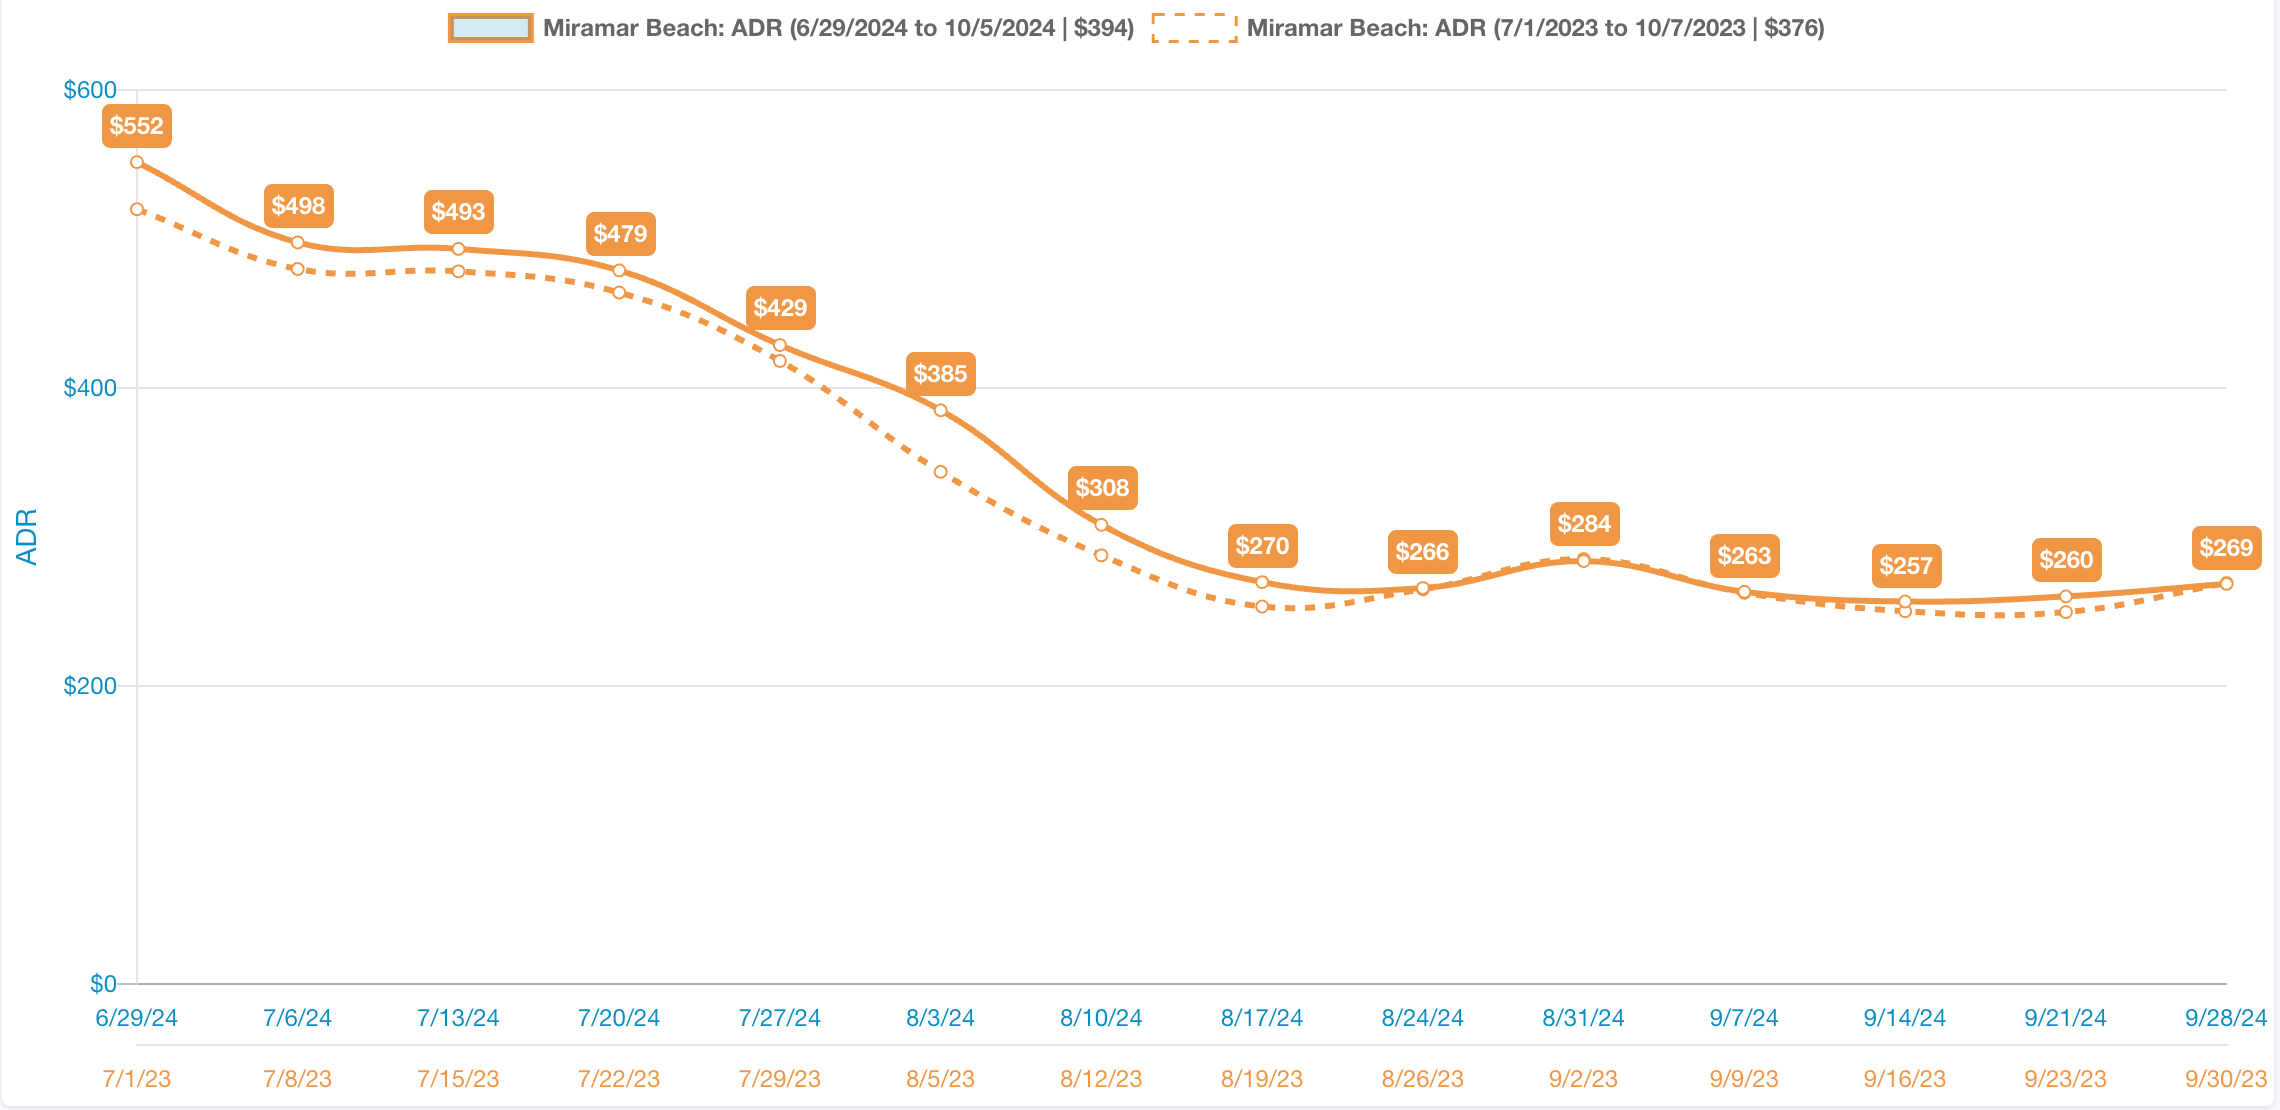
The ADR for Q3 2024 for the Miramar Beach market was $361, actually up 2.3% from 2023’s $353. Looking at the graph, you can see a similar pattern but weekly ADR’s are consistently above those of last year. With occupancy down slightly and ADR’s up slightly, the balance equates to a flat year over year total revenue in the quarter. July, August and September were all slightly up in ADR over last year. 2024 ADR comparison for the quarter with 2022 is down 8.8%, which is the least change YOY in Q3 between all three markets we represent. Q3 2024 ADR of $361 is 46.6% up over Q3 2019’s $246.
July 2024 ADR was $493, up from $481 in 2023 and down from $536 in 2022.
August 2024 ADR was $326, up from $315 in 2023 and down from $372 in 2022.
September 2024 ADR was $266, up from $265 in 2023 and down from $282 in 2022.
October 2024 Performance
October has been a strong and consistent performer these last few years and 2024 is no different. For the NWFL Panhandle market, since 2022, occupancy has dropped just 8%, ADR has dropped just 2.6% and overall average revenue generated per property for the month has dropped just 10.4% since 2022. Changes from 2023, occupancy dropped 4%, ADR was flat with total average revenue generated per property has dropped that same 4%. October has continued to be a solid last push for STR revenue in our market before the winter season sets in.
Q3 2024 Performance Charts

*All data is sourced from KeyData. According to KeyData, Panama City Beach data is sourced from +/- 6,150 properties and 118 managers; 30A data is sourced from +/- 5,900 properties and 129 managers; and Miramar Beach data is sourced from +/- 2,450 properties and 82 managers.